| Code | Region | B02 | B03 | B04 | B05 | B06 | B07 | B08 | B09 | B12 | B13 | B14 | B15 |
|---|---|---|---|---|---|---|---|---|---|---|---|---|---|
| R01 | Belo Horizonte | Key | Key | Key | Key | Key | |||||||
| R02 | B. Cocais | Key | Key | Key | Key | Key | |||||||
| R03 | Caeté | Key | Key | Key | Key | ||||||||
| R04 | Catas Altas | Key | Key | Key | |||||||||
| R05 | Congonhas | Key | Key | Key | |||||||||
| R06 | Diamantina | Key | Key | Key | Key | Key | |||||||
| R07 | Mariana | Key | Key | Key | |||||||||
| R08 | Ouro Preto | Key | Key | Key | Key | ||||||||
| R09 | Sabará | Key | Key | Key | Key | Key | |||||||
| R10 | Santa Bárbara | Key | Key | Key | Key | ||||||||
| R11 | São João del Rei | Key | Key | Key | Key | Key | |||||||
| R12 | Serro | Key | Key | Key | |||||||||
| R13 | Tiradentes | Key | Key | Key | Key | ||||||||
| R14 | Rest of MG | Key | Key | Key | Key | Key | |||||||
| R15 | Rest of BR | Key | Key | Key | Key | Key | Key | Key | Key | Key | Key | Key |
Heritage Tourism and Economic Development:
An Input-Output Analysis for Minas Gerais, Brazil
2023-07-30
Aknowledgements

Minas Gerais: an Overview
- Population: 20.5 million (2022)
- #2 in Brazil
- HDI: 0.774 (2021)
- #4 in Brazil
- GDP: US$ 177 billion (2022)
- 9.3% of national output
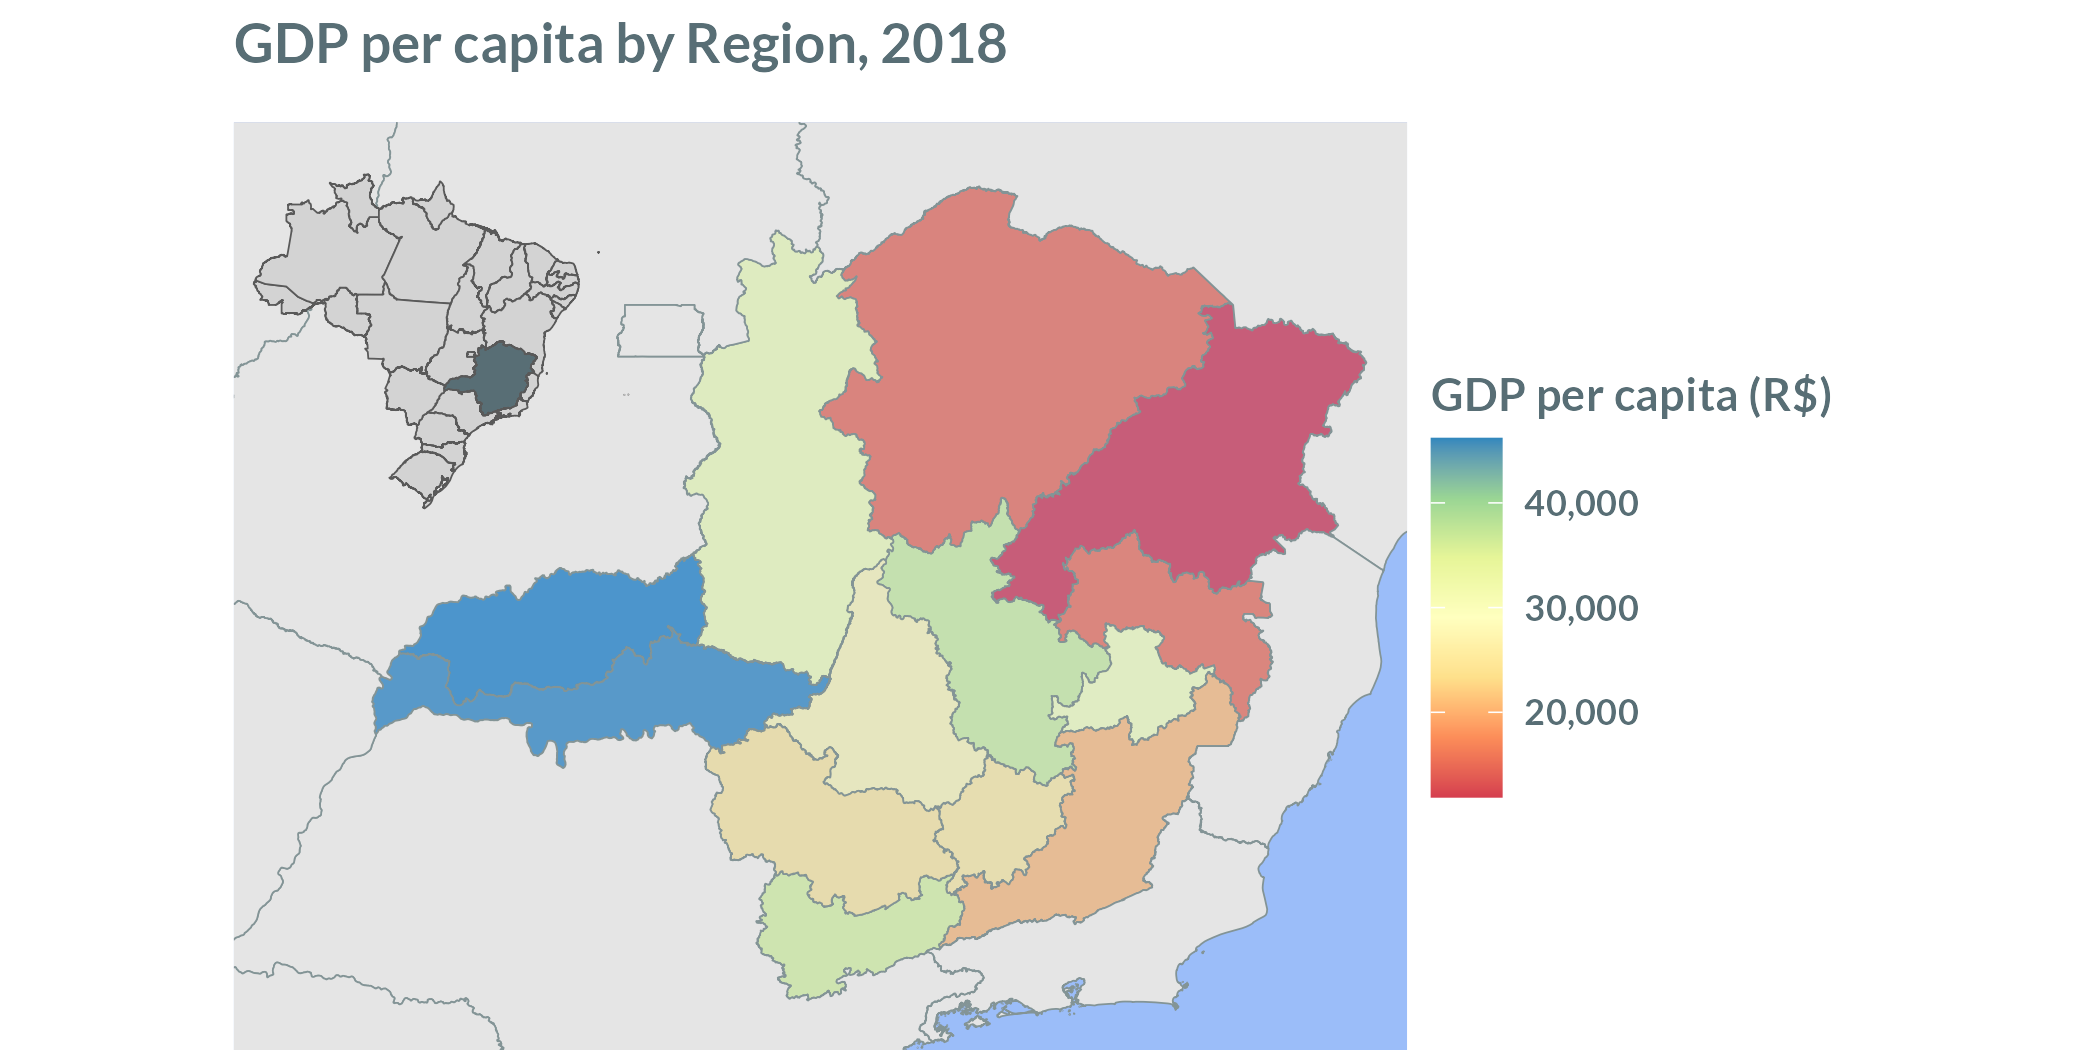
Minas Gerais is a snapshot of Brazil: It reproduces national patterns of income and quality of life disparities
Minas Gerais: an Overview

- Trade (B08), Real Estate (B14), Manufacturing (B04), and Agriculture (B01) account for 46% of the Value Added
- Services (B05-B07, B09-B20): 56% of VA
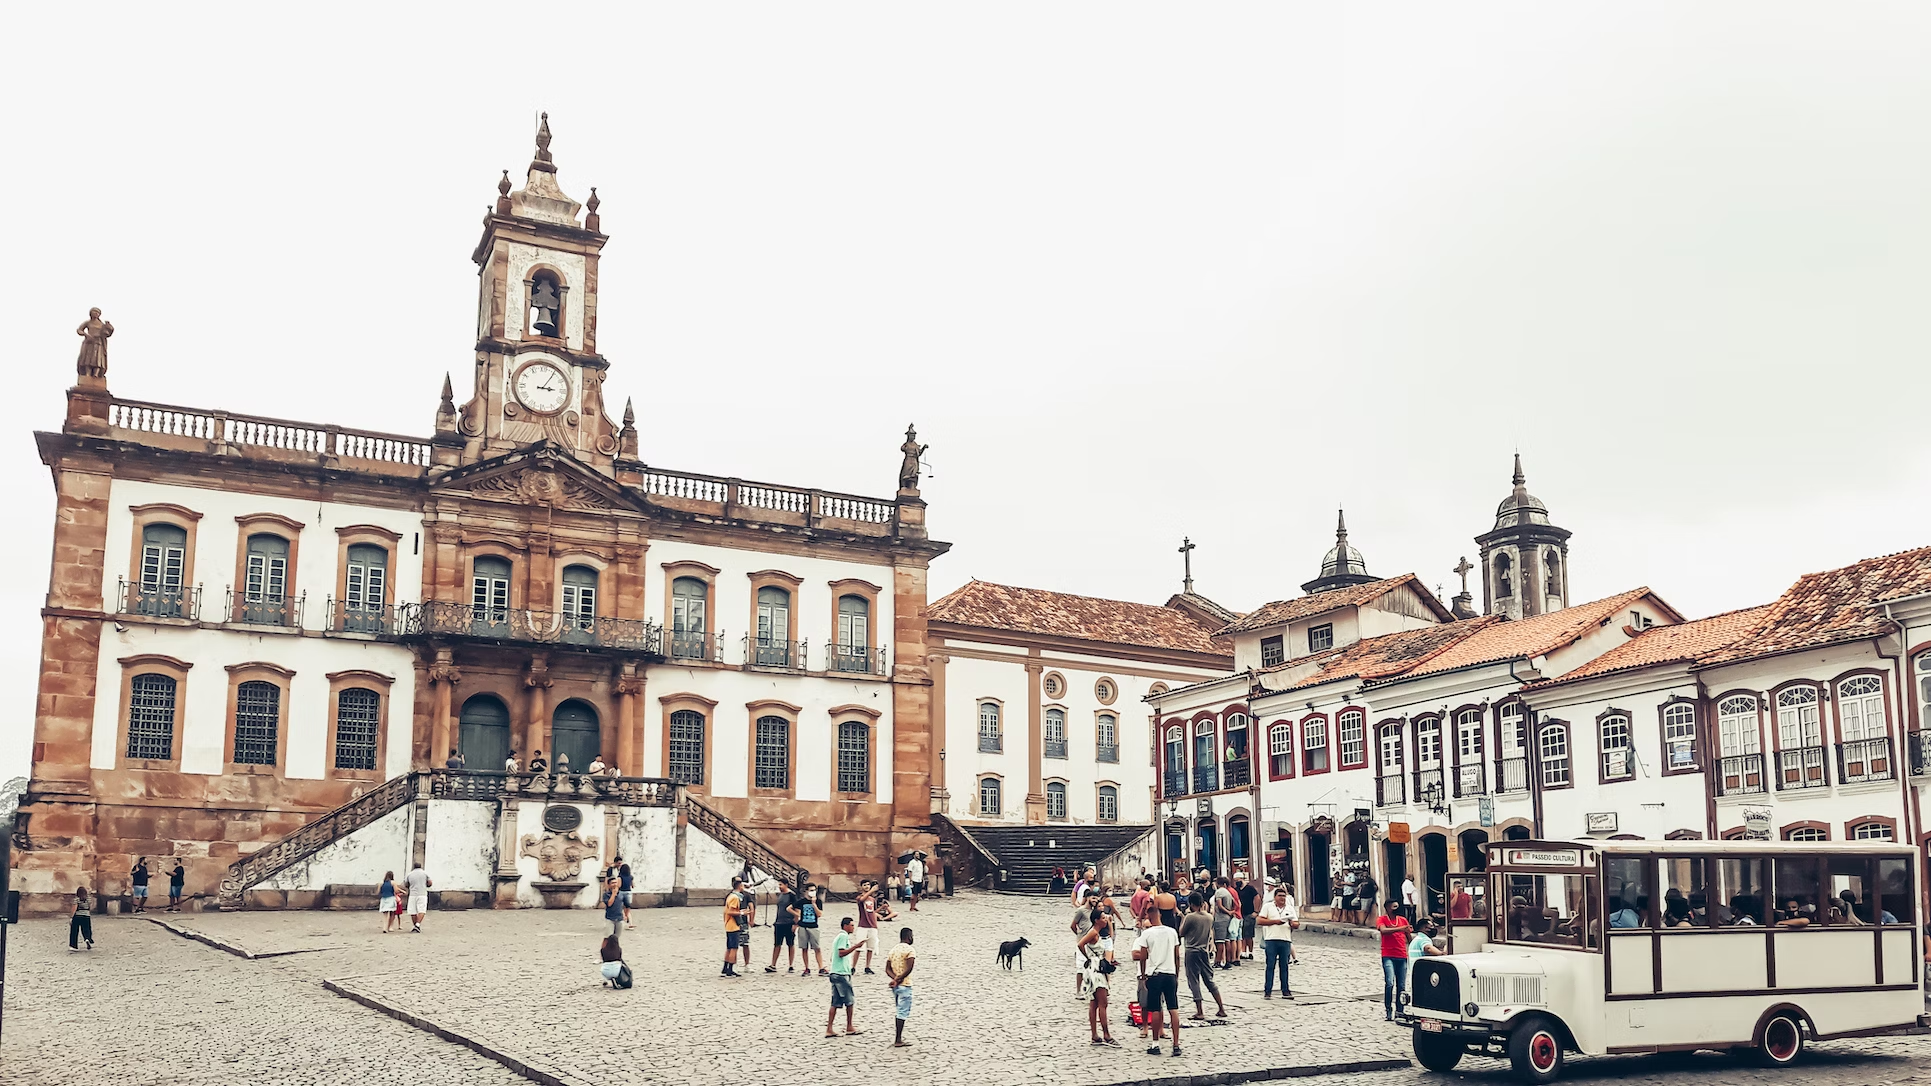
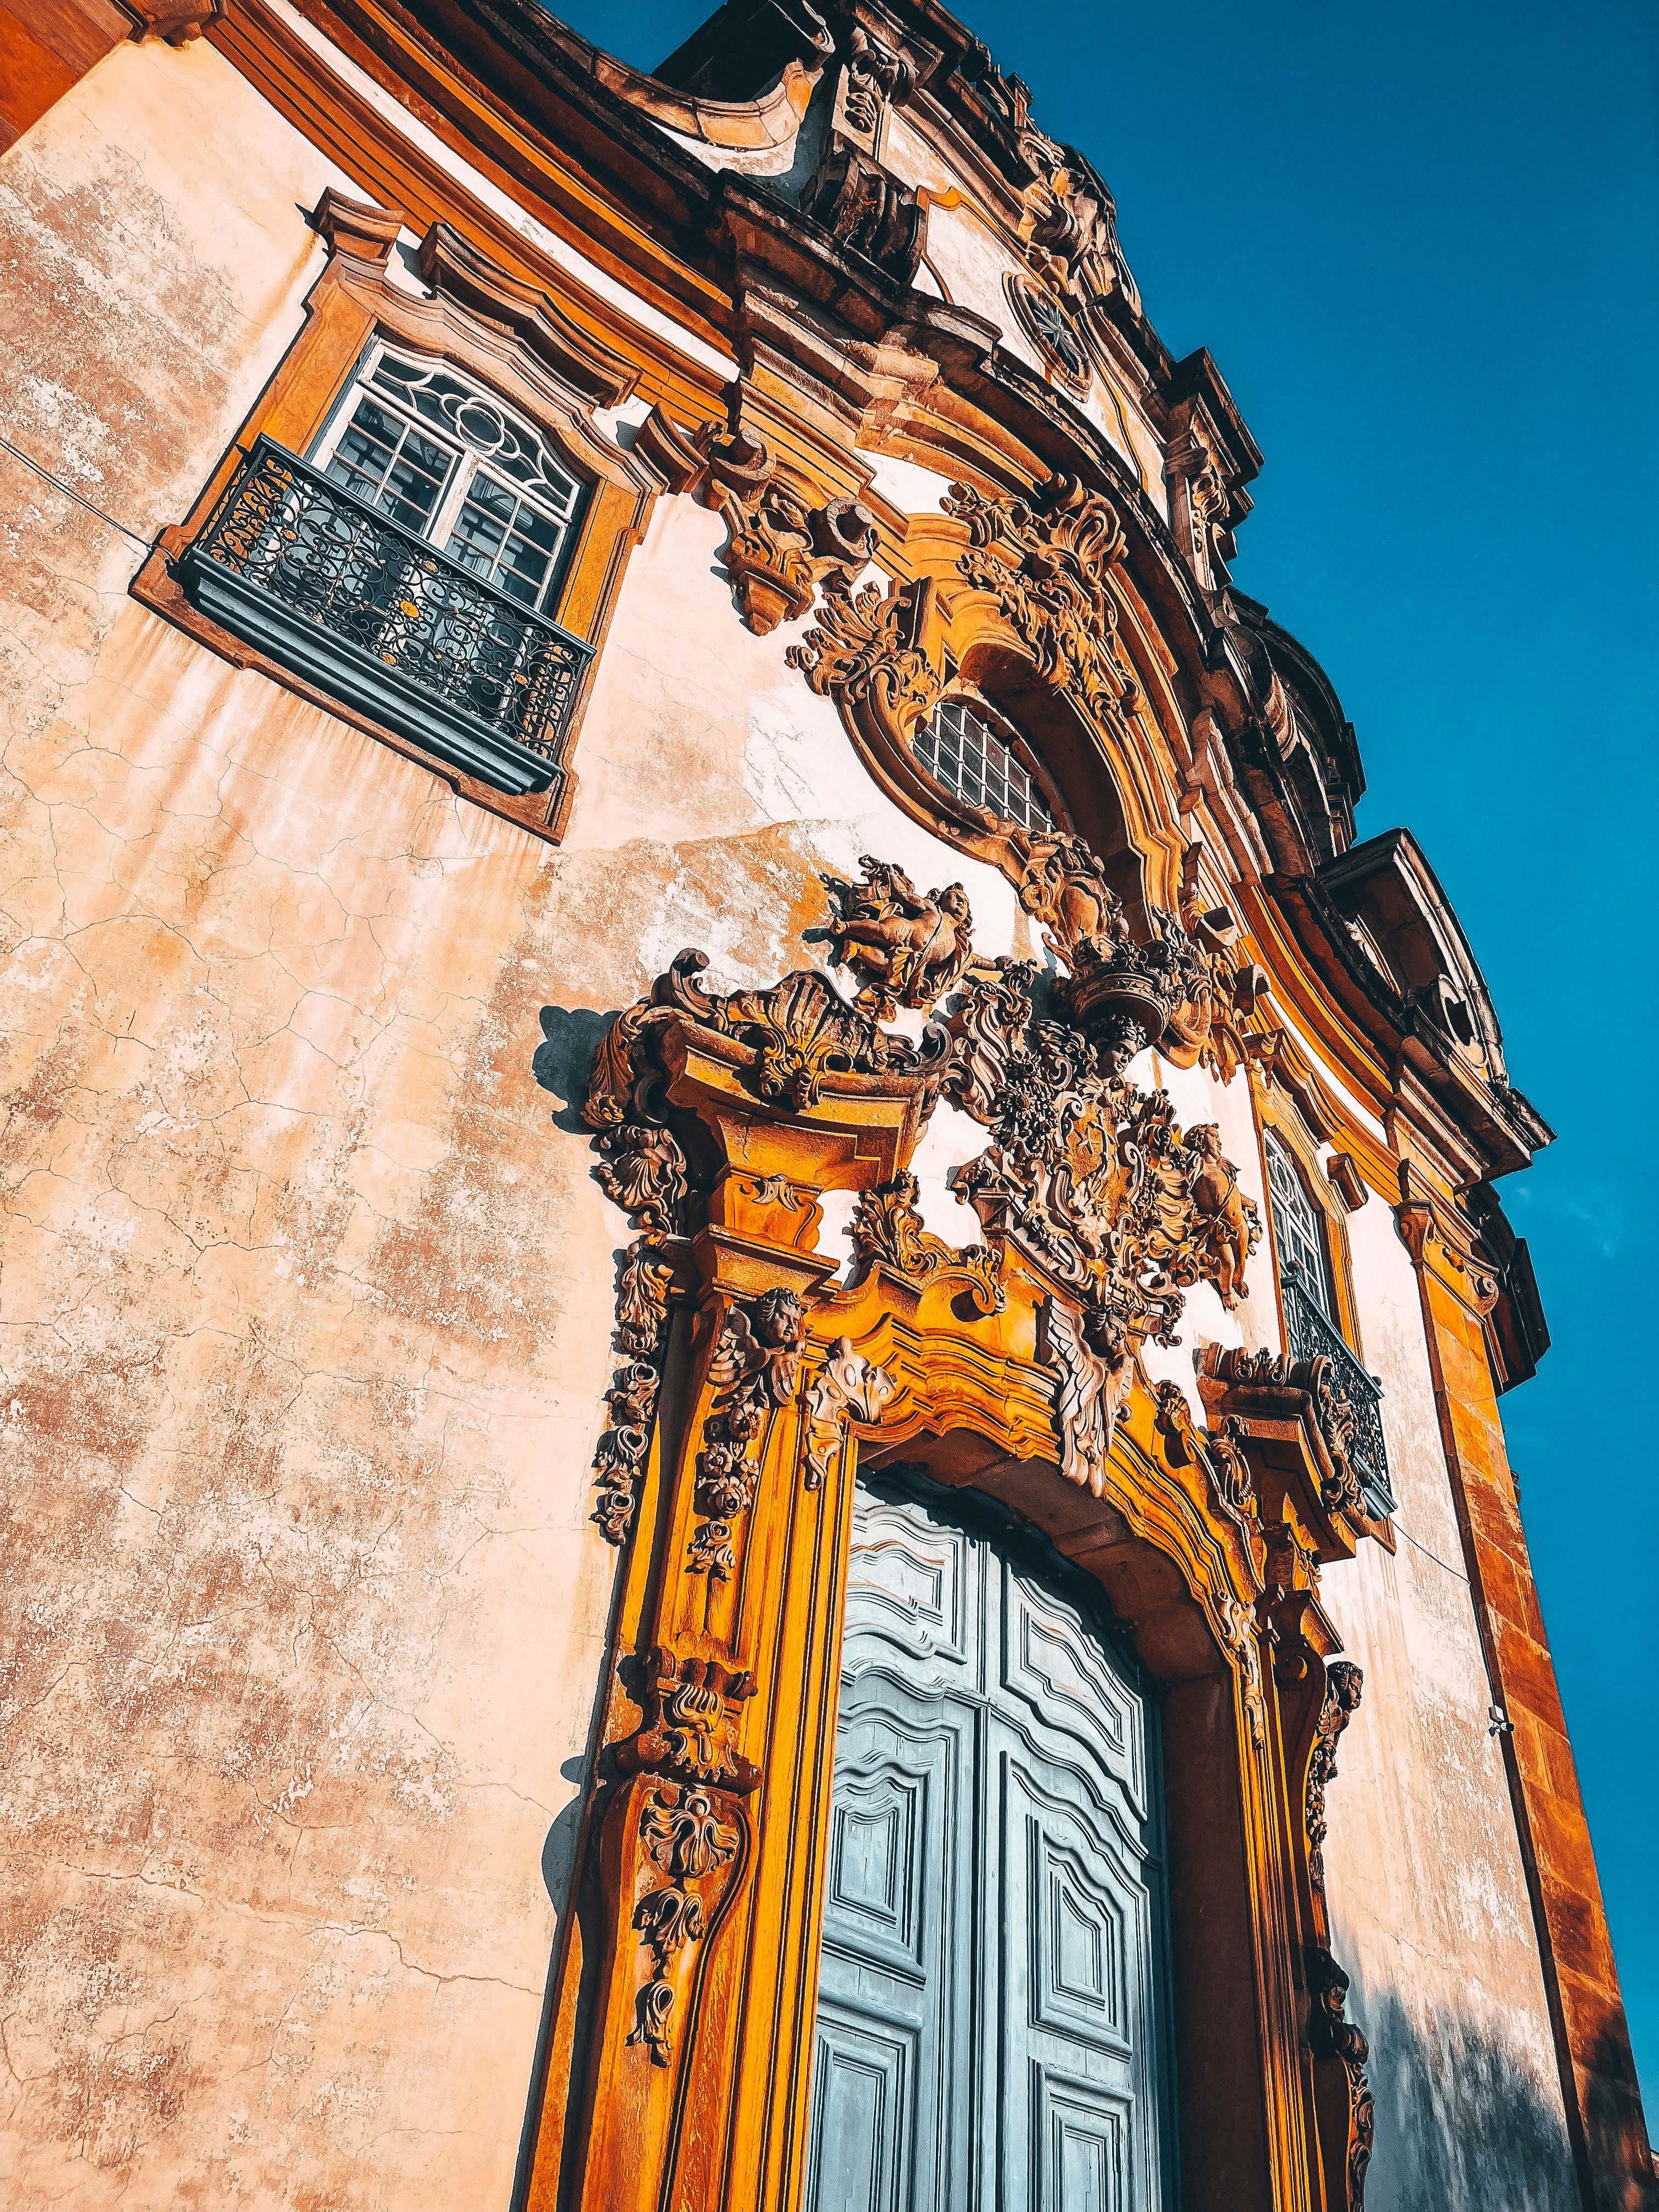
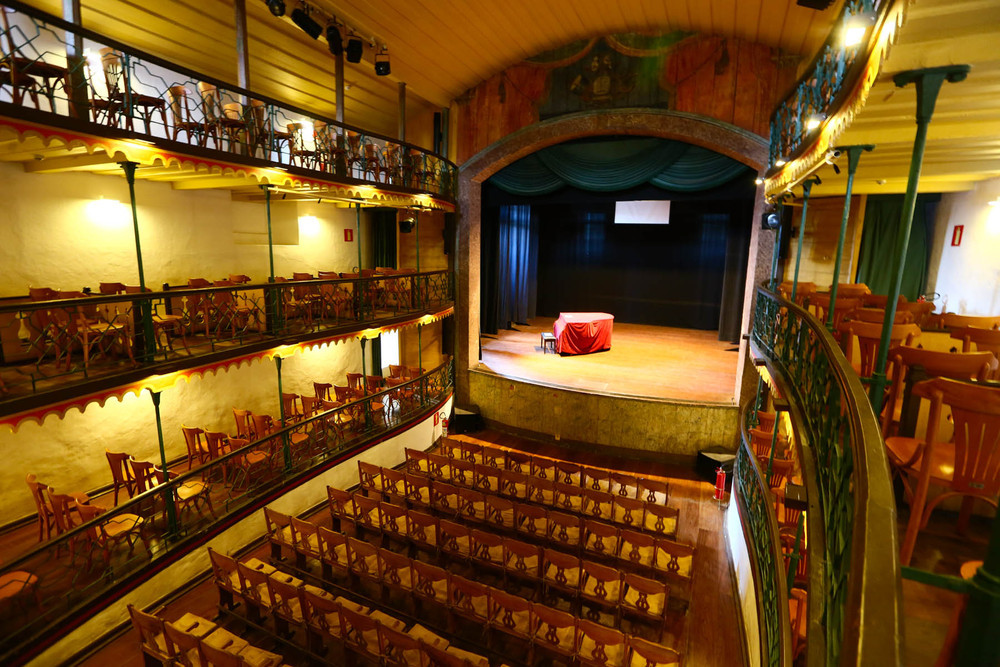
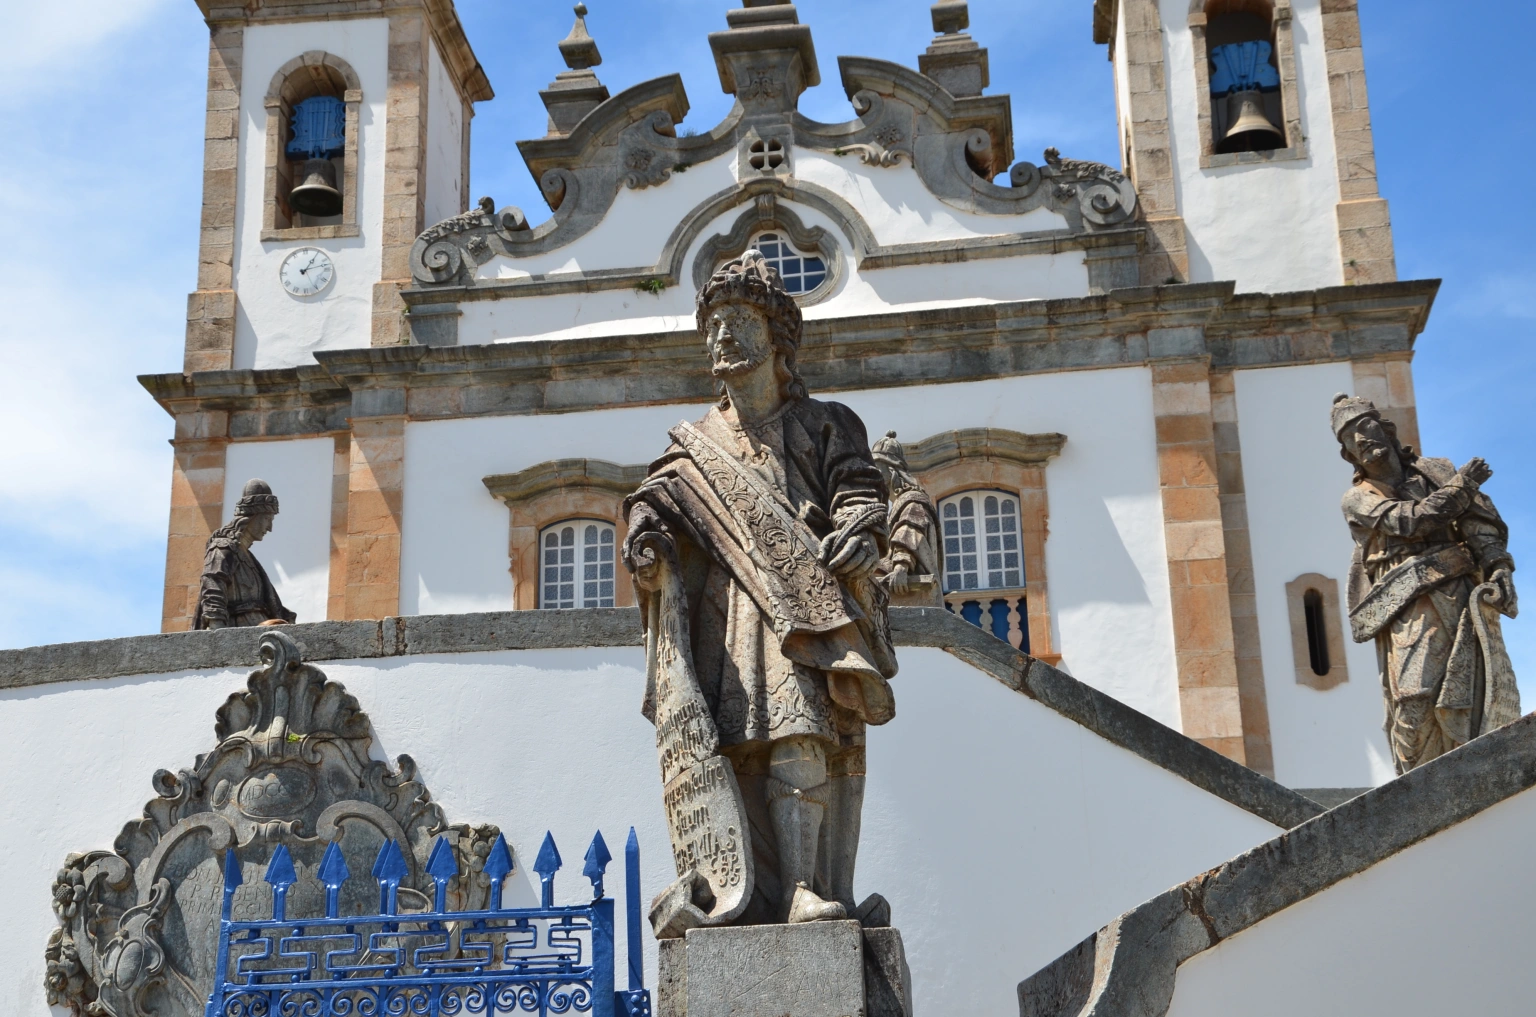
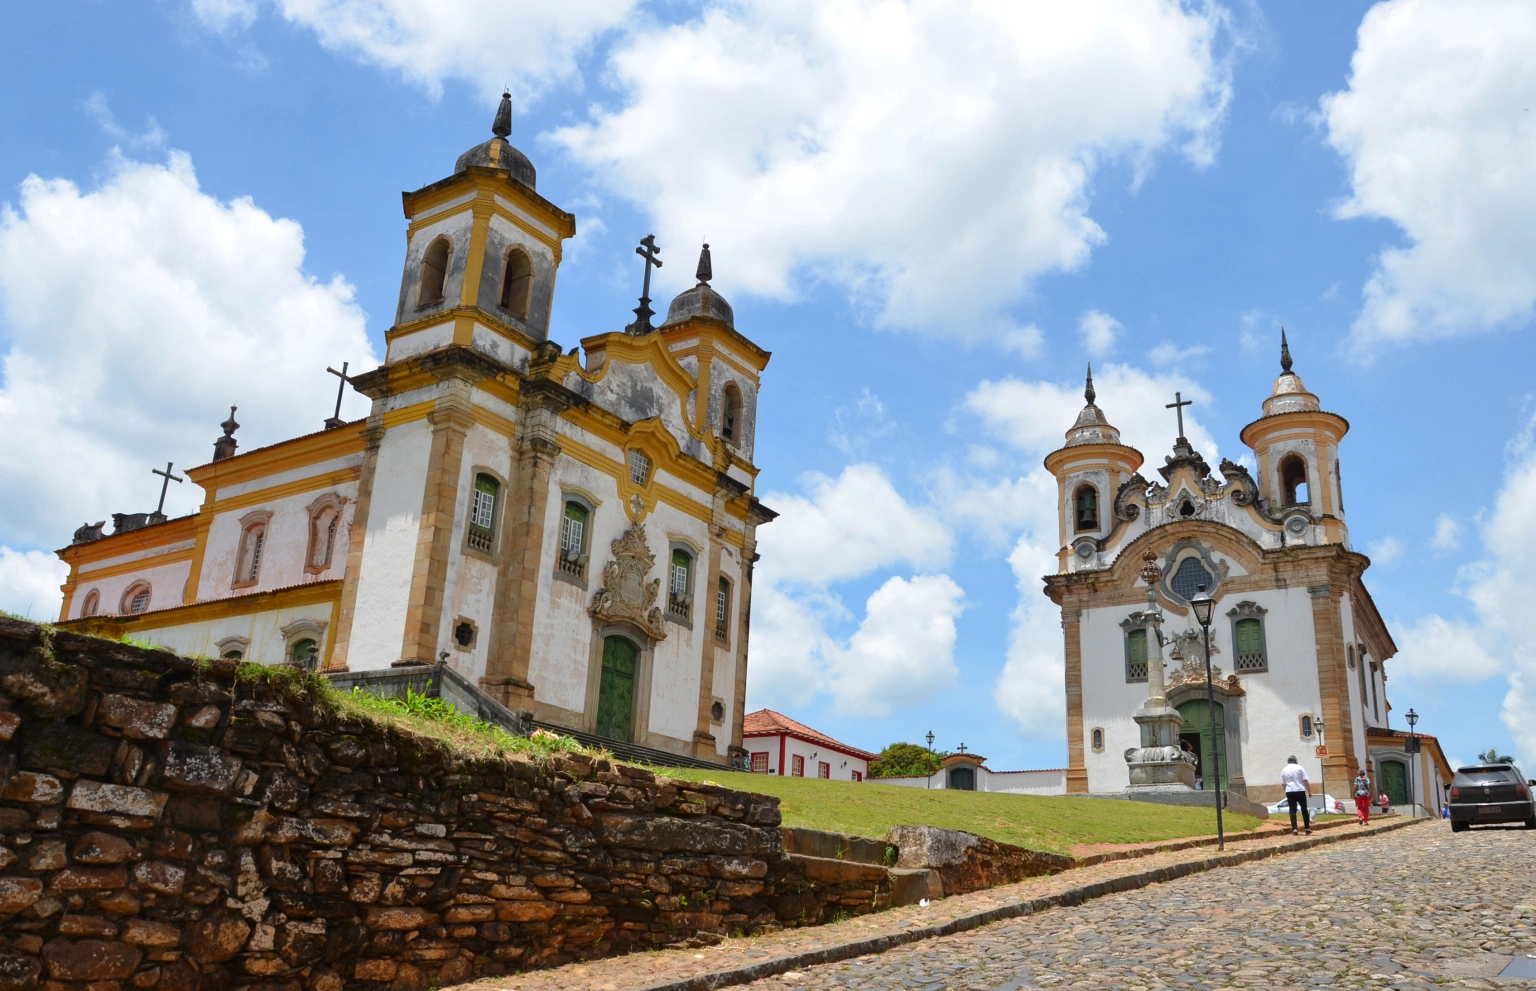
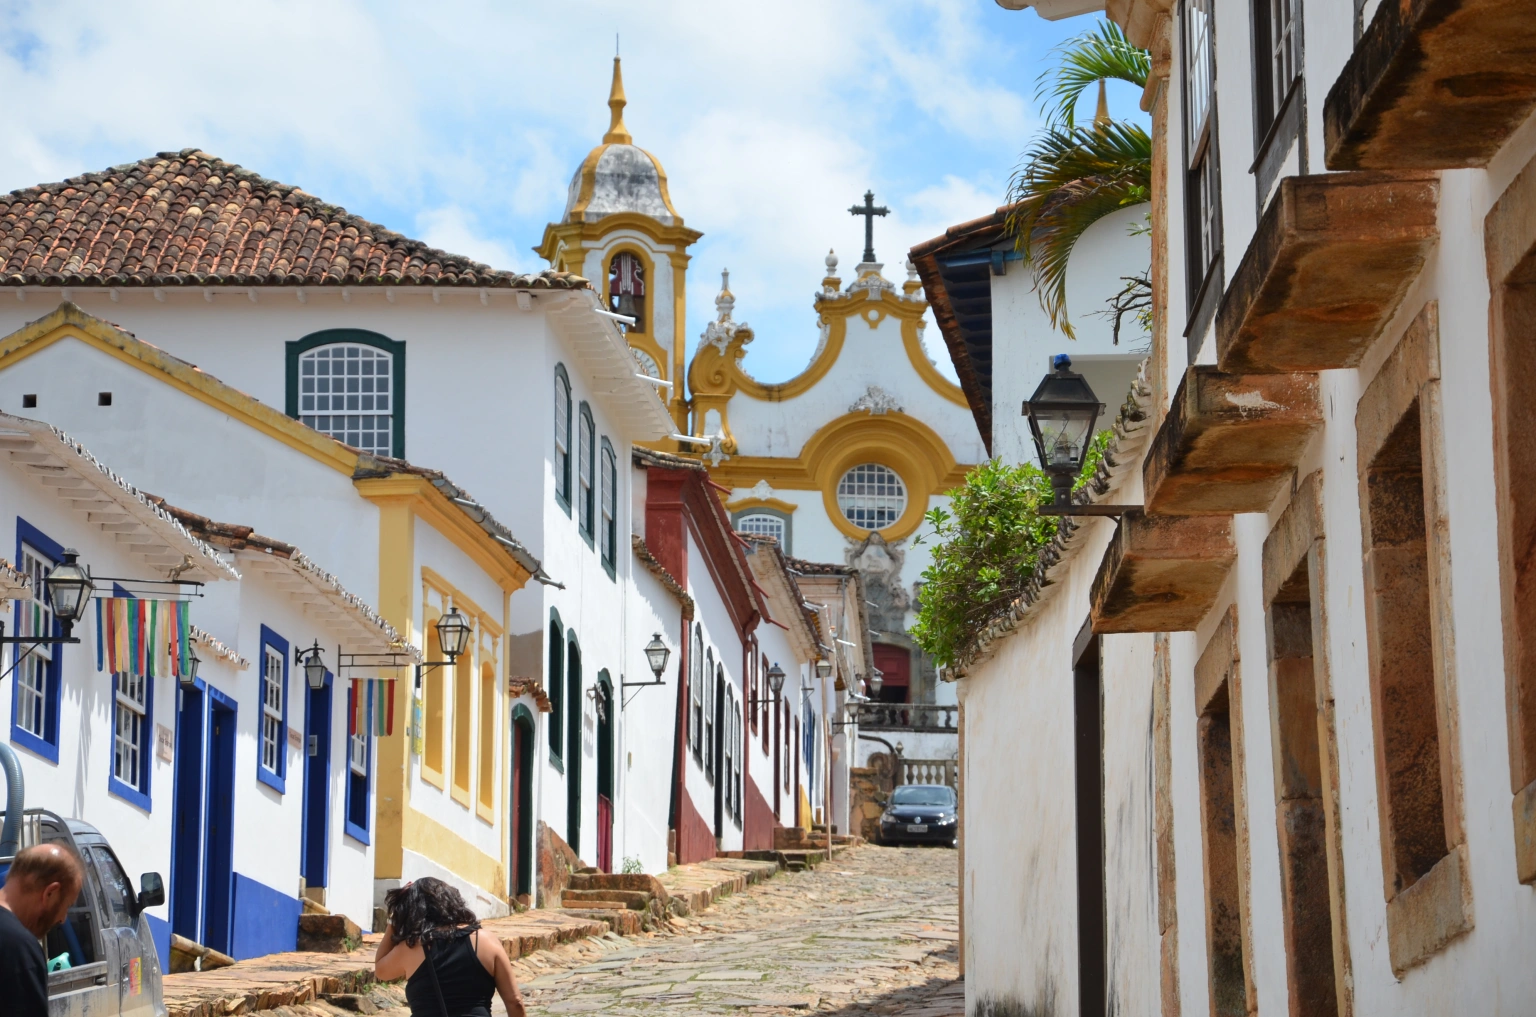
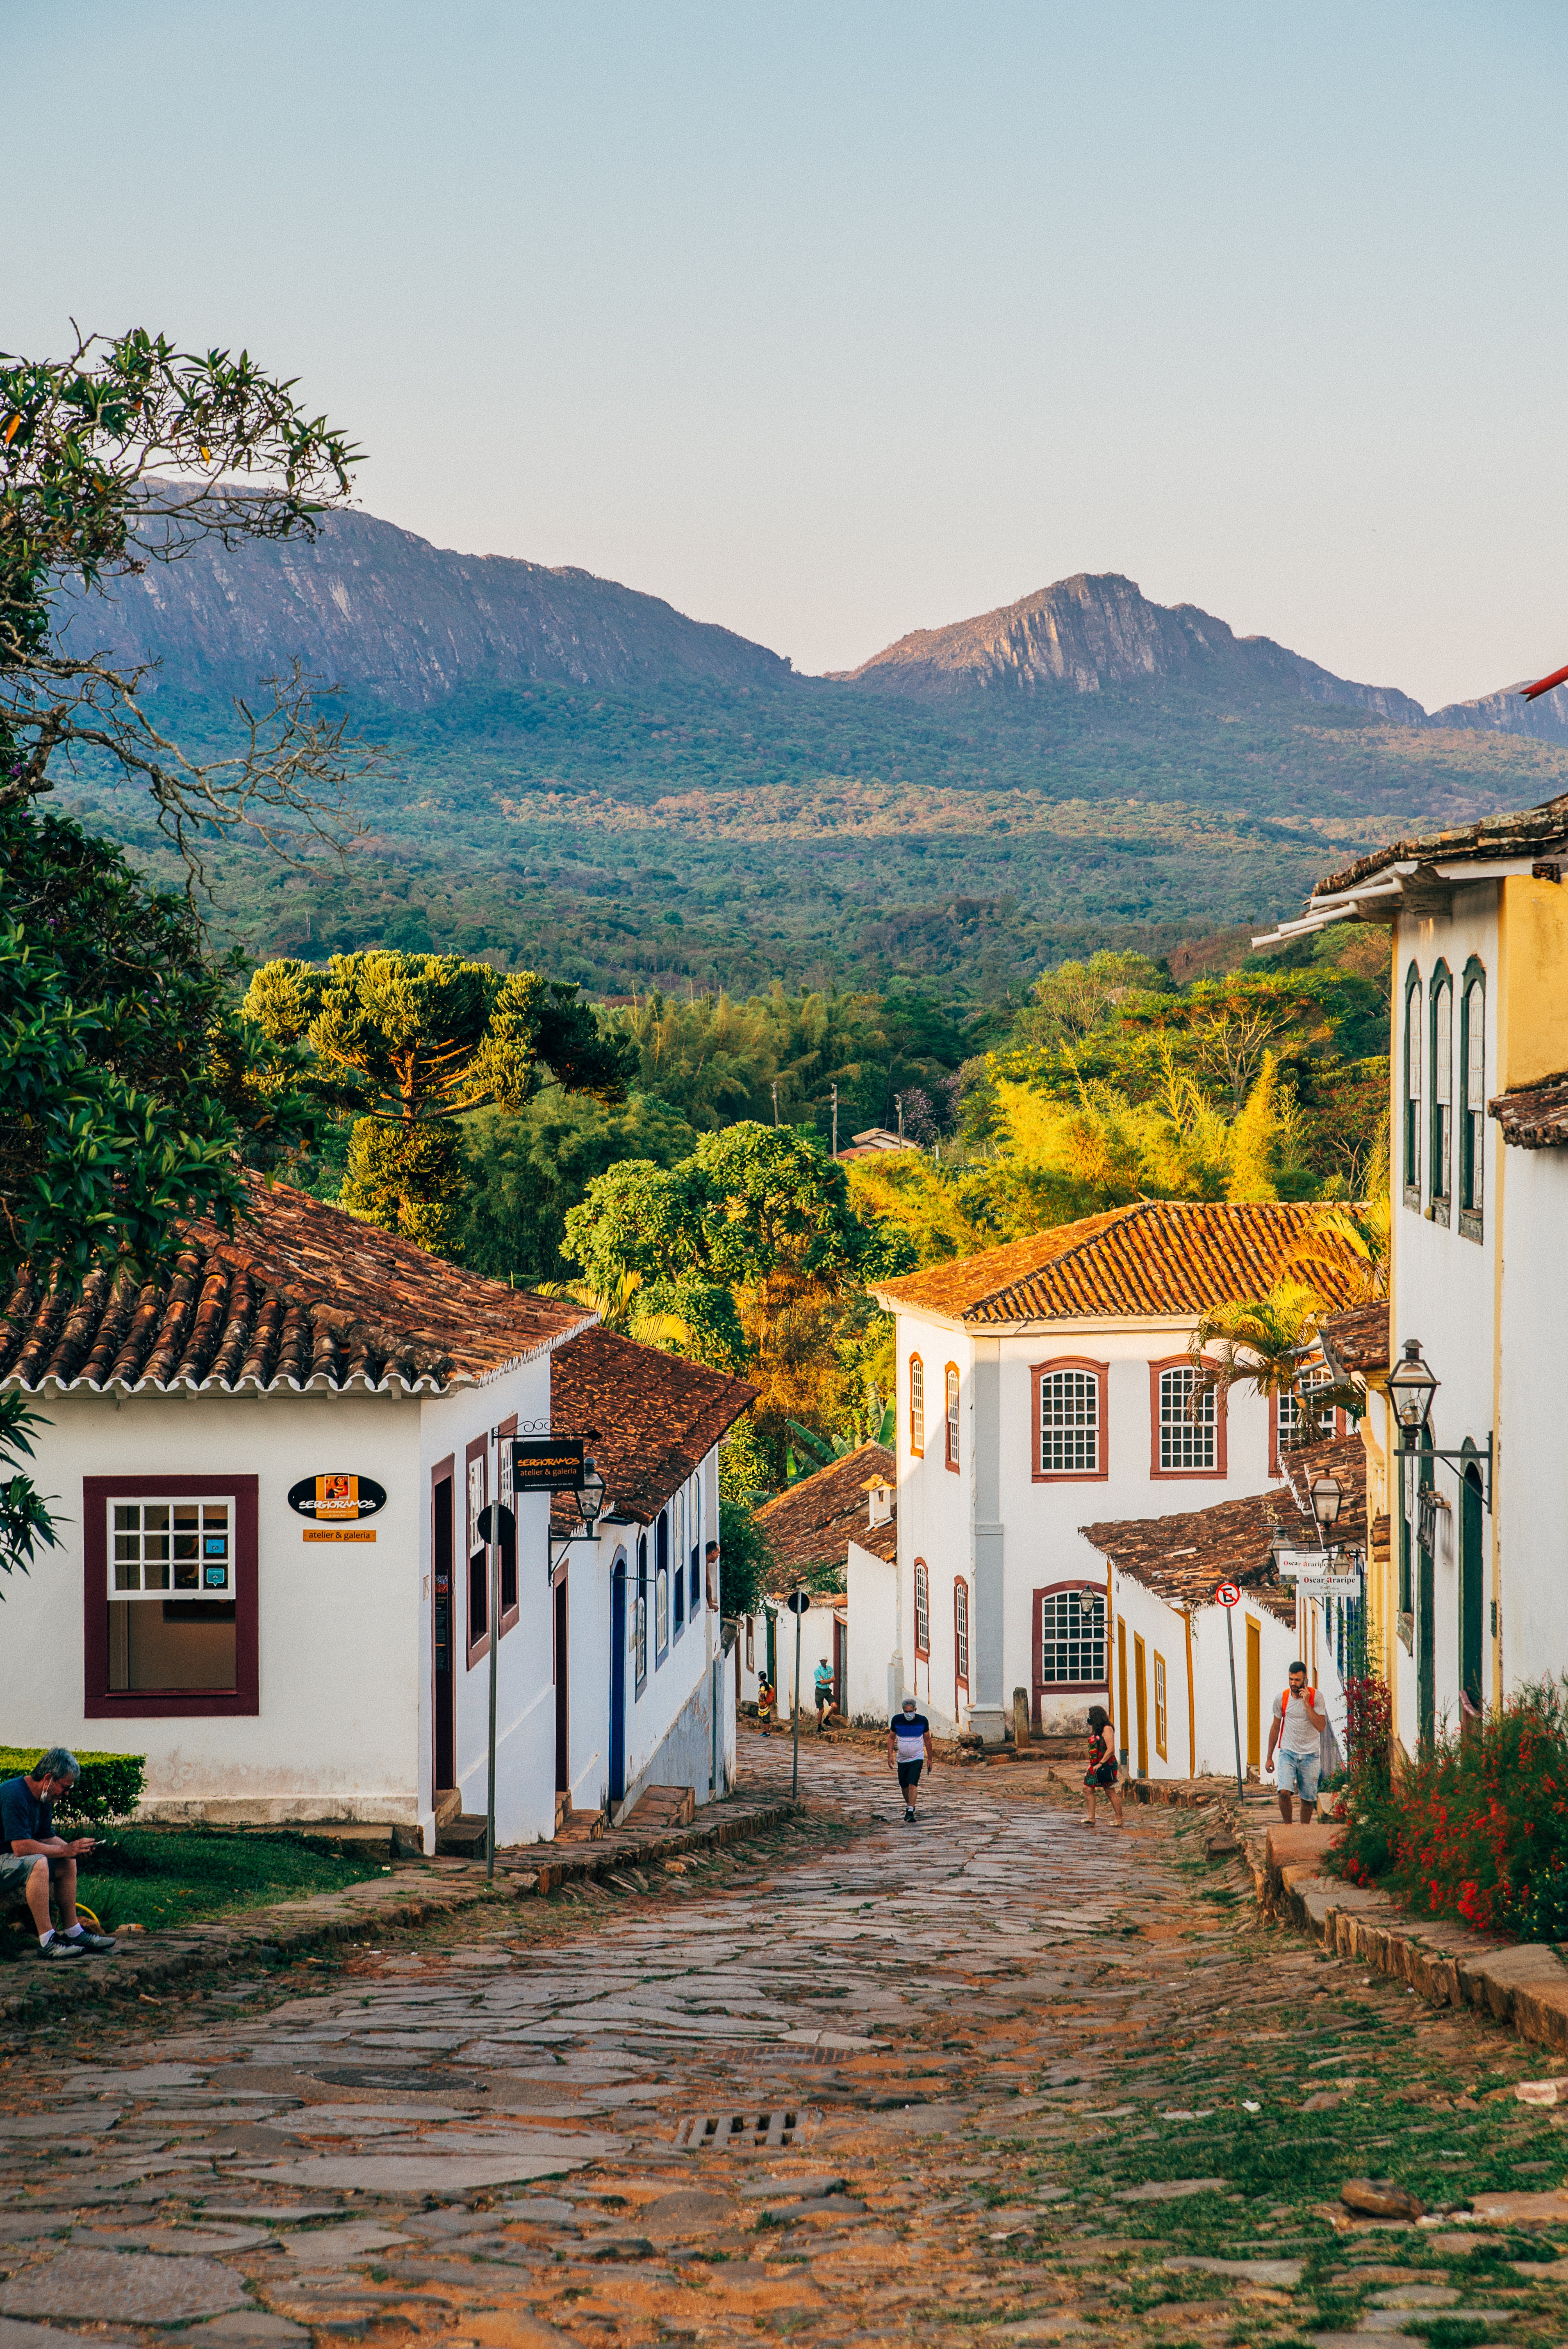
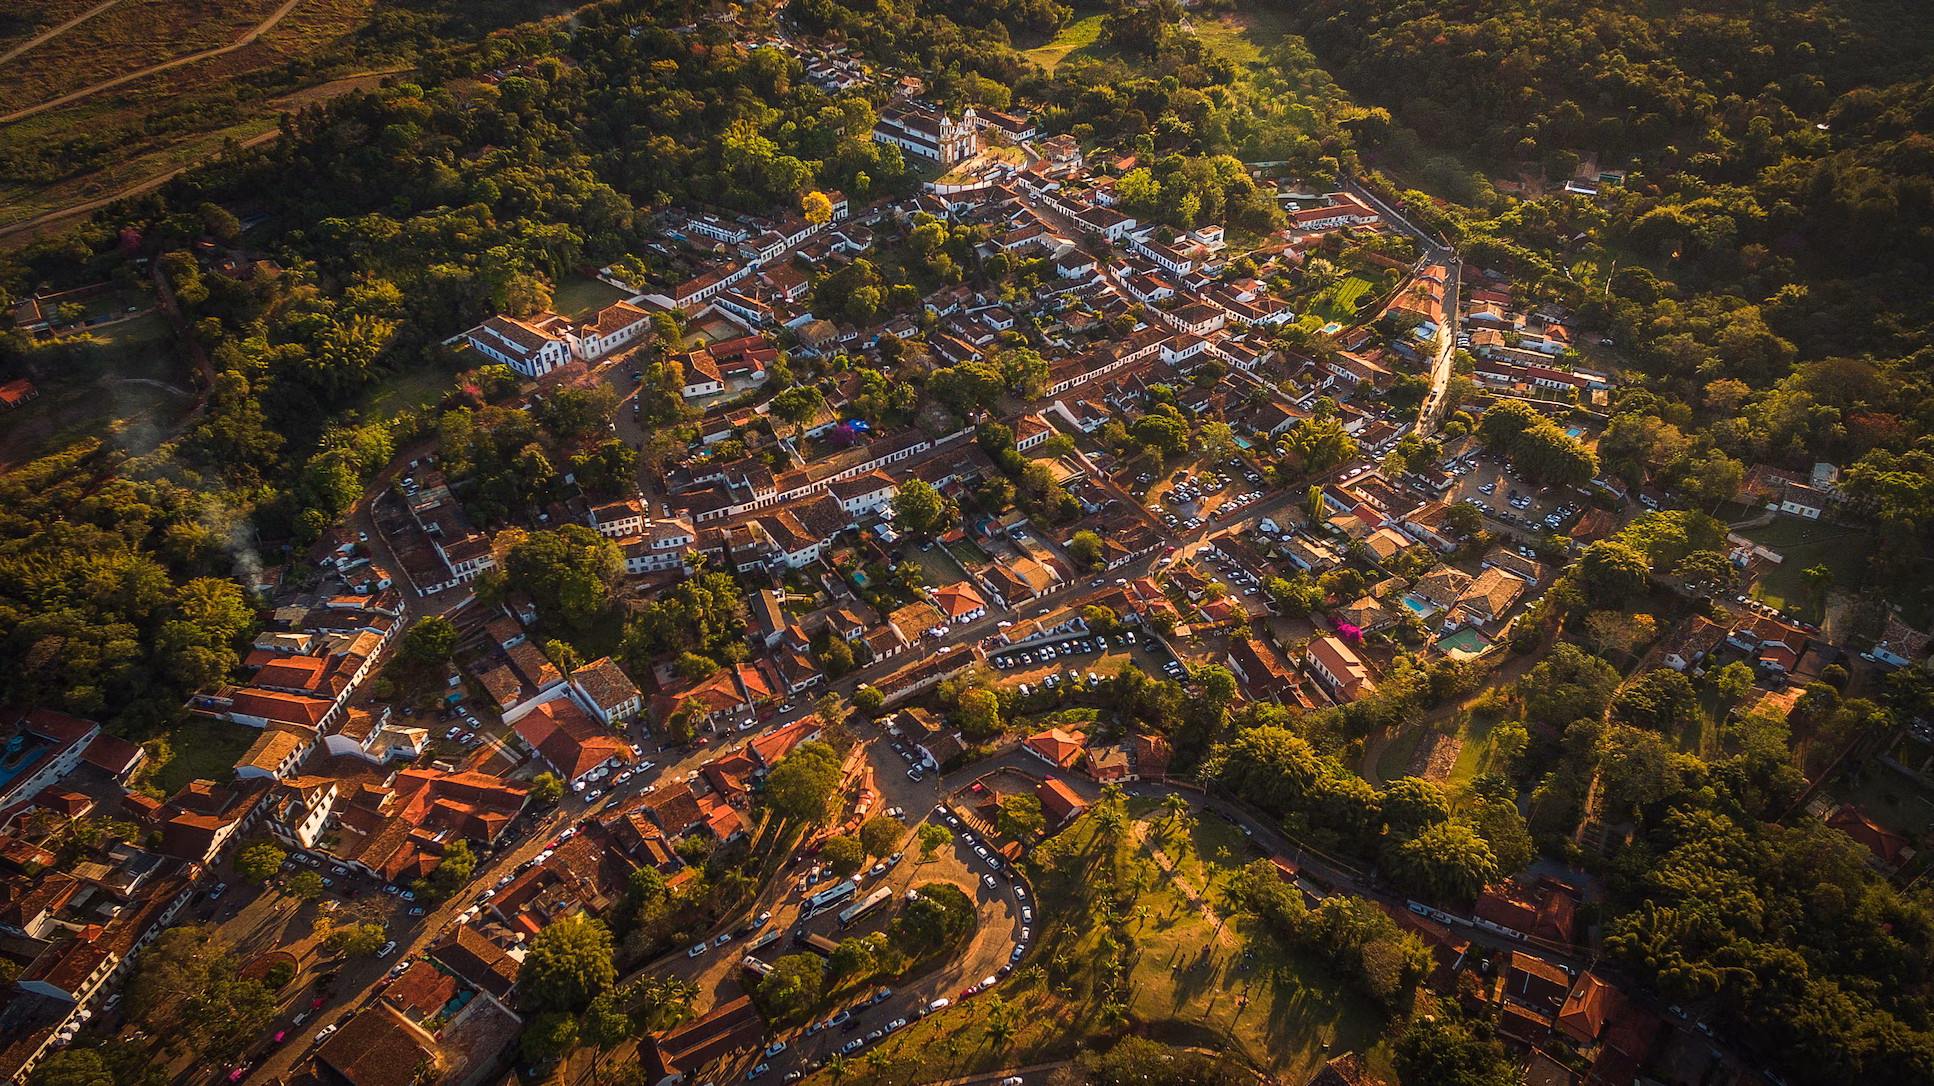
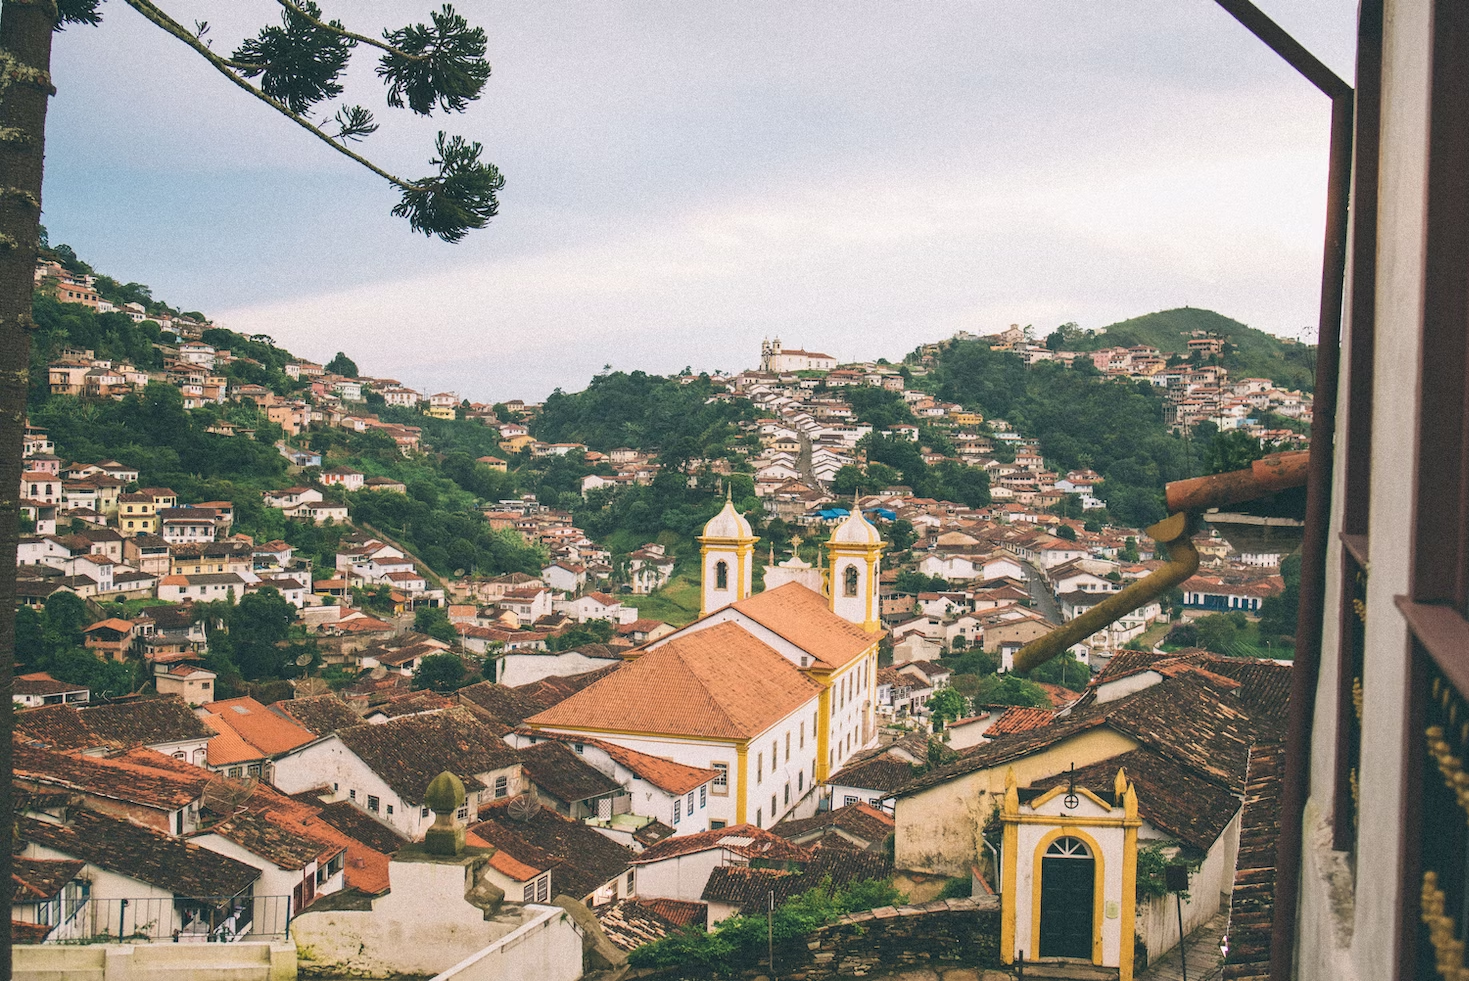
The Baroque Heritage
- Gold run, 17th and 18th centuries
- Portuguese-inspired with local features
- Sacred art, buildings, landmarks
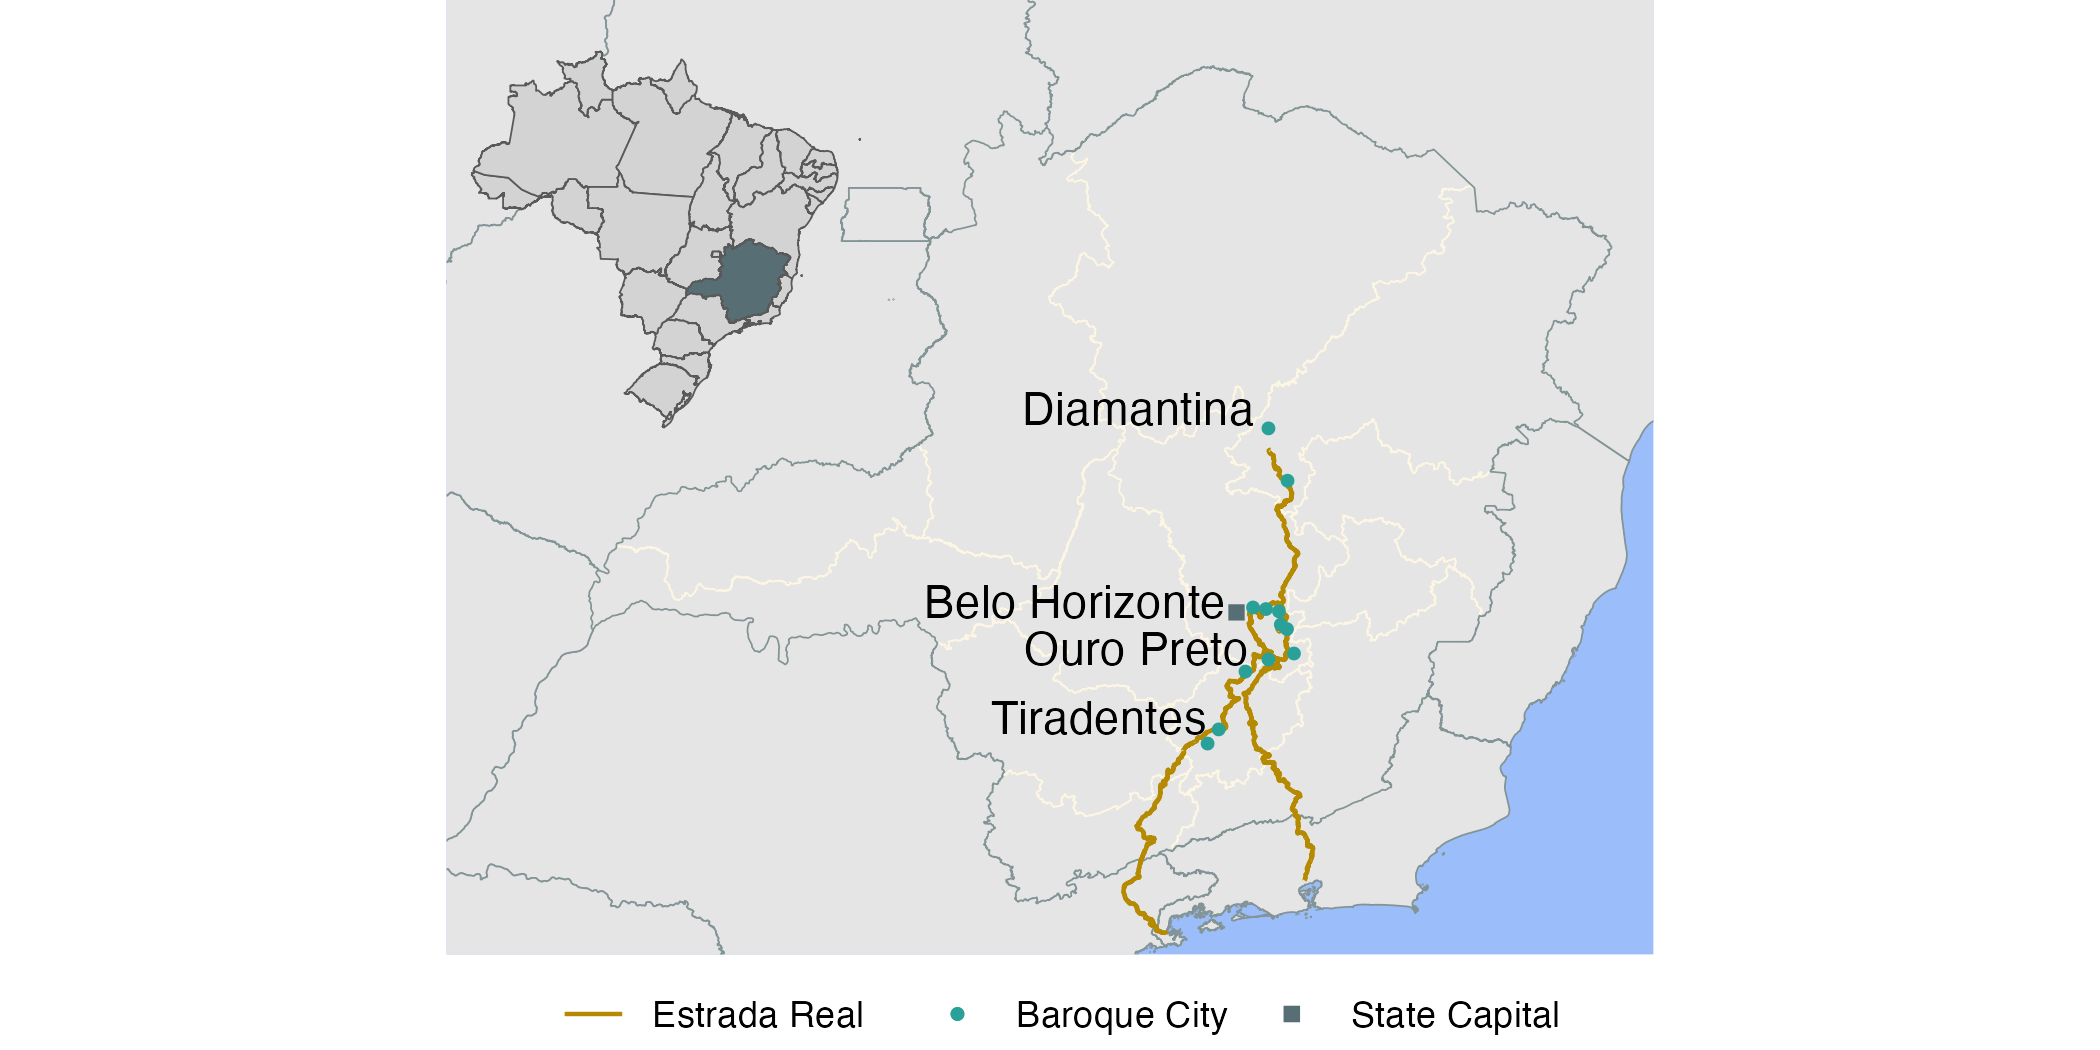
Three Unesco World Cultural Heritage sites: Diamantina, Ouro Preto, and the Congonhas Sanctuary
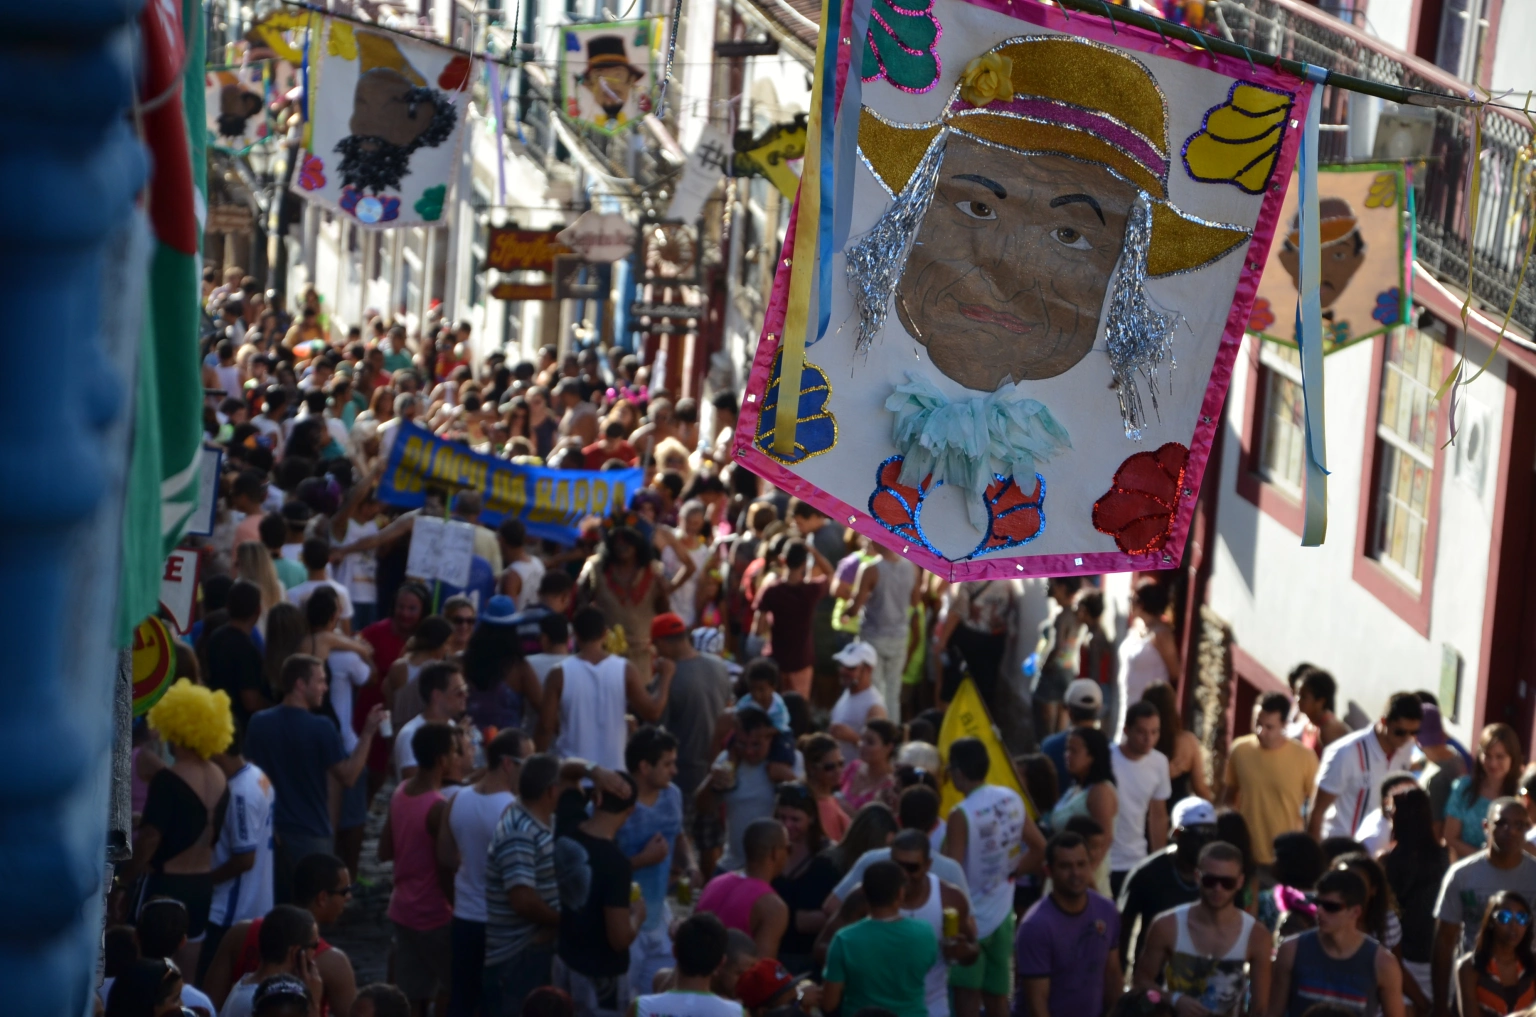
The Baroque Heritage
References

Brazil. 2022a. “Comex Stat - Sobre.” Comex Stat. http://comexstat.mdic.gov.br/pt/sobre.
———. 2022b. “Microdados RAIS e Caged.” PDET - Programa de Disseminação das Estatísticas do Trabalho. http://pdet.mte.gov.br/microdados-rais-e-caged.
Guilhoto, Joaquim José Martins. 2021. “Sistema de Matrizes de Insumo-Produto para o Brasil 2018 - 68 setores.” Nereus.
Haddad, Eduardo Amaral, Carlos Alberto Gonçalves Júnior, and Thiago Oliveira Nascimento. 2017. “Matriz Interestadual de Insumo-Produto Para o Brasil: Uma Aplicação Do Método IIOAS.” Revista Brasileira de Estudos Regionais e Urbanos 11 (4): 424–46.